home
Selected Work
about
news
contact
FAQ
home
Selected Work
about
news
contact
FAQ
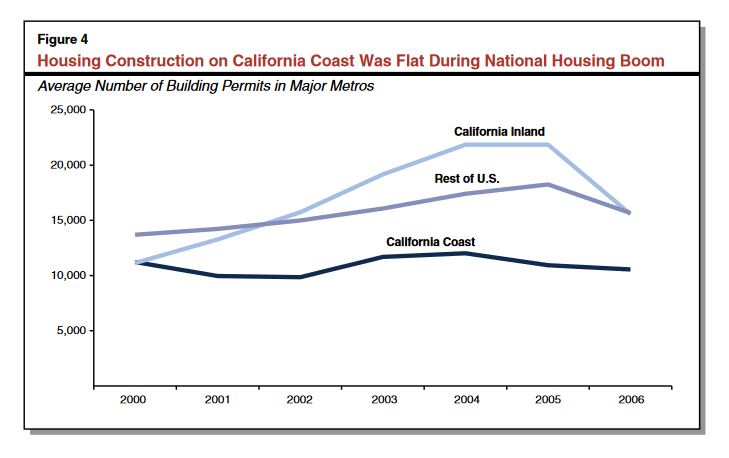
Building Housing Graph CA-1
Related Posts
20
Jan
Eaton & Palisades Fire Response
January 20, 2025
08
Aug
Light Touch Density: Rethinking Single-Family Zones
August 8, 2024
Leave a Reply
Cancel Reply
Save my name, email, and website in this browser for the next time I comment.